2009 Edition Part 4 Figure 4E-2. Pedestrian Intervals

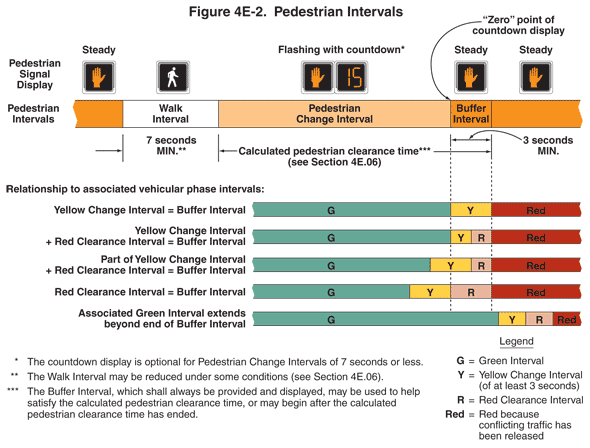
Figure 4E-2. Pedestrian Intervals
This figure shows examples of pedestrian signal intervals.
The following five pedestrian signal displays are shown:
- A solid orange upraised hand symbol labeled "Steady"
- A solid white walking person symbol
- A two-section signal face showing a solid orange upraised hand symbol to the left of a signal showing the numeral "15" in orange and labeled "Flashing with Countdown." A note states "The countdown display is optional for Pedestrian Change Intervals of 7 seconds or less."
- A solid orange upraised hand symbol labeled "Steady."
- A solid orange upraised hand symbol labeled "Steady."
The following pedestrian intervals are shown:
- None during a steady upraised hand display
- A walk interval of 7 seconds MIN. during a walking person display. A note states "The Walk Interval may be reduced under some conditions (see Section 4E.06)."
- A pedestrian change interval with a calculated pedestrian clearance time (see Section 4E.09) that extends into the buffer interval during a two-section upraised hand display flashing with countdown. A note states "The Buffer Interval, which shall always be provided and displayed, may be used to help satisfy the calculated pedestrian clearance time, or may begin after the calculated pedestrian clearance time has ended."
- A buffer interval of 3 second MIN. during a steady upraised hand display. The "zero" point of countdown display is shown at the beginning of the buffer interval.
- None during a steady upraised hand display.
The relationship to associated vehicular phase intervals is as follows:
- Yellow Change Interval = Buffer Interval, shown by a green interval during the pedestrian change interval, a yellow change interval during the buffer interval, and a red interval because conflicting traffic has been released during the steady upraised hand display
- Yellow Change Interval + Red Clearance Interval = Buffer Interval, shown by a green interval during the pedestrian change interval, a 50% yellow change interval and 50% red clearance interval during the buffer interval, and a red interval because conflicting traffic has been released during the steady upraised hand display
- Part of Yellow Change Interval + Red Clearance Interval = Buffer Interval, shown by a 90% green interval and 10% yellow change interval during the pedestrian change interval, a 50% yellow change interval and 50% red clearance interval during the buffer interval, and a red interval because conflicting traffic has been released during the steady upraised hand display
- Red Clearance Interval = Buffer Interval, shown by an 80% green interval and 20% yellow change interval during the pedestrian change interval, a red clearance interval during the buffer interval, and a red interval because conflicting traffic has been released during the steady upraised hand display
- Associated Green Interval extends beyond end of Buffer Interval, shown by a green interval during the pedestrian change interval, a green interval during the buffer interval, and a 10% green interval, 30% yellow change interval, 30% red clearance interval, and 30% red interval because conflicting traffic has been released during the steady upraised hand display
