 |
The average yielding data for all sites for the first year are presented below in Figure 9. The data in Figure 9 shows that the device produces sustained yielding behavior over time. It should be noted that because all 18 devices were not installed simultaneously not all data point represent the average data for all 18 sites. The baseline, 7 day, 30 day, 60 day and 90 day data represent data for all 18 sites. The 180 day data only represents data for 17 sites, while the 270 day data represent data for 15 sites, and the 360 day data only represent data for 10 sites. The 730 day data point is only based on the first site to be installed.
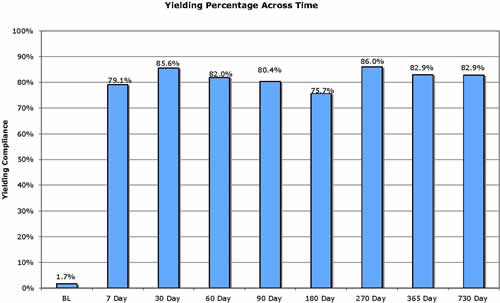
Figure 9 - Effectiveness of the Rectangular-shaped Rapid Flashing LED Beacon
|
United States Department of Transportation - Federal Highway Administration |
||