 |
Participants consisted of drivers traveling on 18 multilane roads in the city of St. Petersburg, Florida. More detailed evaluations were performed at the following locations: 1st Street south of 37th Avenue North; 58th Street south of 3rd Avenue North; 22nd Avenue North @ 7th Street; and 31st Street north 54th Avenue South.
The crosswalk at 1st Street traversed four lanes, had a posted speed limit of 35MPH, and an ADT (Average Daily Traffic Count) of 8,596. This location provided a crossing between two bus stops and included a pedestrian refuge island in the middle of the crosswalk. The 58th St. crosswalk traversed four lanes, had a posted speed limit of 35 MPH, and an ADT of 19,192. It also had a refuge island and provided a crossing for the residents of a near-by retirement center. The 22nd Avenue North crosswalk traversed four lanes, had a posted speed limit of 35 MPH, and an ADT of 18,367. It is equipped with a refuge island and provided crossing for neighborhood residents to and from a large dog park. The 31st St. crossing traversed three lanes at the crossing itself, had a posted speed limit of 35 MPH, and an ADT of 9,600. It had a refuge island and provided crossing between an over-flow parking lot and a large community sports complex. Each of the above sites is on roads carrying two-way traffic. Each site also had a "Yield Here to Pedestrian" advance yielding sign approximately 30 ft. in advance of the crosswalk along with the in-roadway advance yield markings. The data for these four sites will be presented first.
The treatment of primary interest in this experiment was two (2) rectangular LED flashing beacons as shown in Figure 2. The LED flashers on the front and back were each six (6) inches wide, 2.5 inches high, and placed nine (9) inches apart. Each unit was dual indicated (LED's on front and back). Each side of the LED beacon flashed in a wig-wag flashing sequence (left light on, then right) - the two LED's in combination flashed 190 times in the wig-wag flashing sequence during a 30 second cycle. Of the two LED's, the Left LED, flashed Two times (in a slower type of a rapid flash) each time it was energized followed by the Right LED, which flashed in a very fast rapid three (3) flash volley when energized. Four (4) signs along with beacons were installed at each crosswalk. Radio frequency transmitters linked the devices so a depression of any of the pedestrian call buttons activated the flashers on all four signs. A separate LED facing the pedestrian flashed to indicate to pedestrians that the system was operating. The system also presented an audible message instructing pedestrians that the light flashing across the street indicates that the device was operating, and instructing them to wait for cars to stop before crossing.
The comparison device included a pre-existing traditional over-roadway incandescent yellow beacon. This beacon was located at the 58th St. site described above. The system was activated with a pedestrian call button. The standard traditional systems employed two 12-inch diameter yellow beacons facing each direction of traffic. The beacons flashed at a rate of 55 times per minute.
During each session, data were collected on a sample of 20 pedestrian crossings. These crossings occurred when vehicles were present that could influence crossing behavior. Data were collected during both day and nighttime hours at two of these sites. All data were collected on weekdays when it was not raining. Observers measured the following 6 behaviors: the number of drivers who did and did not yield to pedestrians in crosswalks, the percentage of drivers who yielded at <10ft., 10ft.-20ft., 20ft.-30ft., 30ft.-50ft., 50ft.-70ft., 70ft.-100ft., and >100ft, the number of cars that passed or attempted to pass a stopped/yielding vehicle, and the number of cars that demonstrated a sudden and heavy, use of brakes behind a stopped car.
Observers scored the percentage of motorists yielding and not yielding to pedestrians. A motorist was scored as yielding if he or she stopped or slowed and allowed the pedestrian to cross. A motorist was scored as not yielding if he or she passed in front of the pedestrian but would have been able to stop when the pedestrian arrived at the crosswalk. The ITE signal timing formula was used to determine the duration of the yellow signal phase on traffic lights was used to determine whether a driver could safely stop. Calculating the distance before which a motorist can safely stop for a pedestrian is essentially the same problem as calculating the distance that a motorist can stop for a traffic signal that changes to red. Traffic engineers use the signal-timing formula (Institute of Transportation Engineers, 1985), which takes into account driver reaction time, safe deceleration rate, the posted speed, and the grade of the road. A landmark associated with this distance was identified for vehicle approach to the crosswalk. The landmark at three of the sites was the start of a solid line lane divider painted on the roadway in place of the dashed lane lines (Figure 3). A fourth location was marked with white "X's" at the threshold point. Motorists who passed this landmark before the pedestrian started to cross could be scored as yielding to pedestrians but not for failing to yield because they may not have sufficient distance to safely stop. Motorists beyond the landmark when the pedestrian entered the crosswalk could be scored as yielding or not yielding because they had sufficient distance to safely stop. When the pedestrian first started to cross, only drivers in the first half of the roadway were scored for yielding (e.g., approaching vehicles). Once the pedestrian reached the median, the yielding behaviors of motorists in the remaining two lanes were scored. This procedure was followed because it conformed to the obligation of motorists specified in the Florida Statutes.
Staged crossings always followed a specific crossing protocol. First, the pedestrian placed one foot in the crosswalk when an approaching vehicle was just beyond the ITE dilemma zone. If the vehicle made no attempt to stop, the pedestrian did not proceed to cross and scored the vehicle as not yielding. If the vehicle clearly began to yield and the next lane was free, the staged pedestrian would begin crossing. The staged pedestrian always stopped just before the lane-dividing line and made sure the next lane was clear before proceeding. If a large gap appeared the staged pedestrian continued crossing to the median island where this protocol was continued until the crossing was complete. This is essentially the protocol followed by police officers when they conduct pedestrian crossing enforcement "sting" operations. This protocol ensures the safety of the staged pedestrians. Residents were only scored if they initiated a crossing in the same manner as the staged pedestrian by placing at least one foot in the crosswalk. Pedestrians that did not place a foot into the crosswalk were not scored because according to the Florida Statutes, drivers are not required to yield unless the pedestrian is in the crosswalk.
The distances yielding motorists yielded in advance of the crosswalk was recorded. Each yielding motorist generated a yielding distance. The yielding distance was recorded by observing which of several colored flags the motorist yielded behind (see Figure 4).
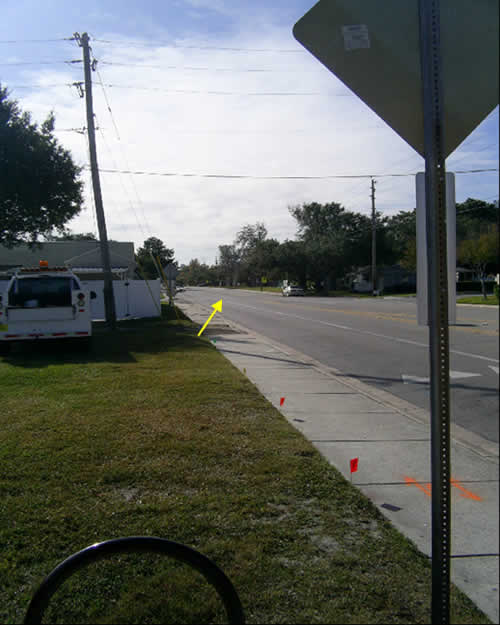
Figure 4. The yellow arrow marks the dilemma zone calculated using the ITE signal timing formula. This Figure also shows the flags used to judge how far the motorists yielded in advance of the crosswalk.
A series of different colored small utility-like flags were placed along side of the curb in each direction of traffic at the distances of 10ft., 20ft., 30ft., 50ft., 70ft., and 100ft. The colors of the flags were red, orange, yellow, green, blue, and red, respectively. This provided a simplified system for recording the distance motorists yielded in advance of the crosswalk within the following distance categories: <10ft., 10ft.-20ft., 20ft.-30ft., 30ft.-50ft., 50ft.-70ft., 70ft.-100ft., and >100ft. The distance a motorist yielded in advance of the crosswalk was recorded only after the pedestrian had completely cleared the lane, was no longer in the path of the vehicle and, thus, the vehicle posed no threat. Yielding vehicles and their distances were recorded only on the front vehicles in each lane. That is to say that if the first car in each of four lanes yielded, only their yielding, distance, and other data were recorded. No data were recorded on the vehicles stopped behind the front cars due to the fact that it is impossible to discriminate whether the back vehicles stopped in order to yield to a pedestrian, to avoid striking the yielded vehicle in front of it, or both.
A driver was recorded as passing a stopped vehicle if they passed a vehicle that was yielding to the pedestrian. A driver was recorded as attempting to pass a stopped vehicle if they did not yield until after they were along side, or past, a yielding vehicle or if the driver behind a yielding vehicle changed lanes to go around but then yielded. This action is an offense under the Florida Statutes.
A car was recorded as jamming on brakes if they were behind a yielding car and the front-end of the car was observed taking a sudden movement toward the ground.
Each session consisted of 20 crossings each. After collecting baseline data on all four roads the rectangular LED beacons were installed in a staggered fashion following a multiple baseline across sites design. The traditional overhead beacon was evaluated prior to the stutter flash beacon at the 58th Street site. Because this treatment only produced a small increase in yielding a return to baseline was not implemented prior to the introduction of the rectangular LED beacon at this site. The rectangular LED beacon was first only installed on each side of the road for a total of two beacon systems per site. Next two additional beacons were added to the pedestrian refuge island for a total of four beacon systems per site. This condition was followed by a return to the two-beacon system followed by the reinstatement of the four-beacon system. Each alternation of two and four systems received five data sheets of observation. This produced a total of 112 data sheets comprised of 2,240 crossings.
Data were also collected at night (after civil twilight) at the 1st Street site. Baseline data were collected for nine (9) data sheets with each alternating phase being collected for five (5) data sheets each. This produced a total of 29 sheets of data and 580 crossings. Night data were collected between the hours of 7:00PM through 11:30PM.
|
United States Department of Transportation - Federal Highway Administration |
||