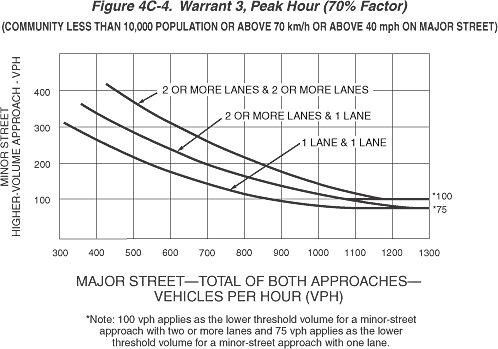
Figure 4C-4. Warrant 3, Peak Hour (70% Factor)
This figure shows a graph depicting numerical values for Warrant 2, Four-Hour Vehicular Volume with the 70-percent factor if the posted or statutory speed limit or the 85th percentile speed on the major street exceeds 70 km/h (40 mph or if the intersection lies within the built-up area of an isolated community having a population of less than 10,000 (see Section 4C.04 for further details). The figure displays three curves—one for each existing combination of approach lanes: one lane and one lane, two or more lanes and one lane, and two or more lanes and two or more lanes.
The table below shows the approximate VPH on the major street and corresponding VPH on the minor street for each combination of approach lanes.
| One lane and one lane | Two or more lanes and one lane | Two or more lanes and two or more lanes | |||
|---|---|---|---|---|---|
| VPH on the major street (Total of both approaches) | VPH on the minor street (Higher volume approach) | VPH on the major street (Total of both approaches) | VPH on the minor street (Higher volume approach) | VPH on the major street (Total of both approaches) | VPH on the minor street (Higher volume approach) |
| 1300 | 75 | 1300 | 75 or 100* | 1300 | 100 |
| 1200 | 75 | 1200 | 80 or 100* | 1200 | 100 |
| 1100 | 75 | 1100 | 100 | 1100 | 120 |
| 1000 | 80 | 1000 | 120 | 1000 | 150 |
| 900 | 100 | 900 | 140 | 900 | 175 |
| 800 | 120 | 800 | 160 | 800 | 225 |
| 700 | 145 | 700 | 200 | 700 | 260 |
| 600 | 170 | 600 | 245 | 600 | 315 |
| 500 | 220 | 500 | 280 | 500 | 370 |
| 400 | 260 | 400 | 340 | 400 | Not available |
