2009 Edition Part 3 Figure 3B-28. Example of the Application of Speed Reduction Markings

Figure 3B-28. Example of the Application of Speed Reduction Markings
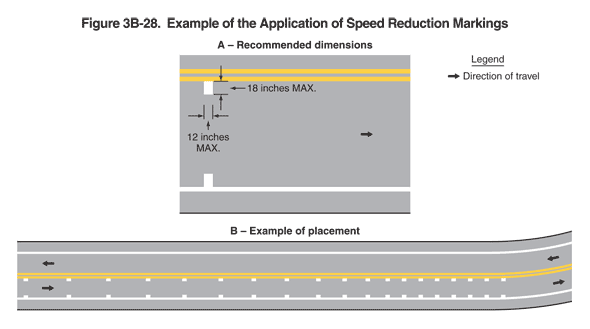
This figure illustrates two examples of speed reduction markings, A and B. A legend shows a black arrow indicating the direction of travel in the lanes.
Example A is labeled "recommended dimensions." It shows a section of one lane of roadway, with a black arrow showing the direction of travel from left to right. A white rectangular marking is shown on the pavement adjacent to the solid yellow centerline and another white rectangular marking on the pavement directly opposite and adjacent to the solid white edge line. The markings are shown as a dimension of 12 inches MAX. along the centerline and edge line and a dimension of 18 inches MAX extending into the travel lane.
Example B is labeled "example of placement." The figure shows a roadway with one lane traveling in each direction, with opposing directions separated by a solid double yellow line. A solid white line is shown to the right of each travel lane. On the lane shown traveling from left to right, the roadway is shown beginning to curve to the north at the right side of the figure. From the left side of the figure on this lane, a series of speed reduction markings are shown adjacent to the centerline and edge line and directly opposite each other in advance of the curve. The horizontal spacing between the sets of markings is shown to decrease closer to the curve.
