|
|
2009 Edition Part 4 Figure 4C-9. Warrant 9, Intersection Near a Grade Crossing (One Approach Lane at the Track Crossing)

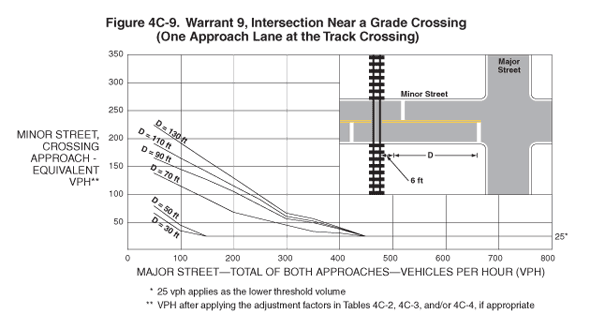
Figure 4C-9. Warrant 9, Intersection Near a Grade Crossing (One Approach Lane at the Track Crossing)
This figure shows a graph depicting Warrant 9, Intersection Near a Grade Crossing (One Approach Lane at the Track Crossing). The figure displays six curves for different distances: 130 ft, 110 ft, 90 ft, 70 ft, 50 ft, and 30 ft. An inset illustration shows vertical railroad tracks crossing a horizontal minor street that intersects a vertical major street east of the railroad tracks. The minor street is shown with one lane in each direction. "D" is shown as the dimensioned distance from 6 ft to the east of the railroad tracks to the minor street stop line at the intersection with the major street.
The table below shows the approximate vehicles per hour (VPH) after applying the adjustment factors in Tables 4C-2, 4C-3, and/or 4C-4, if appropriate, on the major street and VPH for the minor street, crossing approach equivalent.
| D = 130 ft | D = 110 ft | D = 90 ft | D = 70 ft | D = 50 ft | D = 30 ft | ||||||
|---|---|---|---|---|---|---|---|---|---|---|---|
| VPH on the major street (Total of both approaches) | VPH on the minor street, crossing approach equivalent** | VPH on the major street (Total of both approaches) | VPH on the minor street, crossing approach equivalent** | VPH on the major street (Total of both approaches) | VPH on the minor street, crossing approach equivalent** | PPH for total of all pedestrians crossing the major street | VPH on the minor street, crossing approach equivalent** | VPH on the major street (Total of both approaches) | VPH on the minor street, crossing approach equivalent** | VPH on the major street (Total of both approaches) | VPH on the minor street, crossing approach equivalent** |
| 800 | 25* | 800 | 25* | 800 | 25* | 800 | 25* | 800 | 25* | 800 | 25* |
| 700 | 25* | 700 | 25* | 700 | 25* | 700 | 25* | 700 | 25* | 700 | 25* |
| 600 | 25* | 600 | 25* | 600 | 25* | 600 | 25* | 600 | 25* | 600 | 25* |
| 500 | 25* | 500 | 25* | 500 | 25* | 500 | 25* | 500 | 25* | 500 | 25* |
| 400 | 45 | 400 | 45 | 400 | 45 | 400 | 27 | 400 | 25* | 400 | 25* |
| 300 | 60 | 300 | 55 | 300 | 55 | 300 | 45 | 300 | 25* | 300 | 25* |
| 200 | 140 | 200 | 110 | 200 | 100 | 200 | 70 | 200 | 25* | 200 | 25* |
| 100 | 190 | 100 | 160 | 100 | 145 | 100 | 125 | 100 | 50 | 100 | 30 |
| 50 | 225 | 50 | 190 | 50 | 160 | 50 | 145 | 50 | 70 | 50 | 60 |
* Note: 25 vph applies as the lower threshold volume
** VPH after applying the adjustment factors in Tables 4C-2, 4C-3, and/or 4C-4, if appropriate
