 |
VDOT provided an accident database of all accidents occurring from 1999 through 2003 on Interstates 64, 81, and 95. This database was then filtered to crashes to those occurring in a specific time frame and a specific range of locations. For each interchange of interest (test exit), a control interchange was also selected (control exit). This was always the nearest adjacent interchange to the test exit. A before-and-after analysis method was used. The before dates were restricted to 53 weeks prior to logo sign installation up to 1 week prior to installation. The after dates started one week after installation, and continued to 53 weeks after installation. There was thus one year of before data and one year of after data for each test exit and each control exit (the same date ranges were used for the control exits). These dates also allowed for a 2-week buffer period for the time when the signs were being installed. Those crashes occurring from 1,500 ft (actually 0.3 miles or 1,584 ft) before the Full Service Food logo sign up to the exit were used in the analyses. For control exits, those crashes occurring 1,584 ft before the first logo motherboard for that exit up to the exit were used. The variables of interest for these crashes included:
Data from both north and southbound (or east and west bound) directions were used, except for Exit 126 of I-95, which only has a Full Service Food logo sign in the southbound direction. The resulting database consisted of data for the vehicles involved in these accidents. The data were weighted by the number of vehicles to obtain the number of crashes (except for data reported on a vehicle or driver basis, for which no weighting was needed). In addition, the database was weighted for the number of vehicle miles driven through that county on that interstate for a particular year. This helped account for increased traffic over time and allowed for control of exposure in the before-and-after data.
Chi-square tests were used to check for statistically significant differences in the raw frequency of crashes before and after sign installation for the test and control exits. A comparison of the graphical data was used to compare the raw data to the converted rate data (data presented in terms of crashes per million vehicle miles traveled: MVMT).
It should be noted that before-and-after methods of evaluation have been the traditional method of evaluating traffic safety countermeasures. However, in the past few years, researchers have pointed out a potential problem with this type of analysis. The problem is that sites for safety countermeasures are often selected on the basis of a recent surge in crashes at those sites. Crash rates fluctuate randomly over time, and what appears to be an elevated crash risk for one site will often drop back down towards the average level given time, even without safety countermeasures being used.
Traffic engineers will often deploy a safety countermeasure at a site immediately following one of these upswings in crash rates, and then declare the countermeasure a success when the rate drops in the following time period. This phenomenon is known among traffic safety researchers as regression to the mean. The problem is that there is no way of knowing whether the rate would have dropped even in the absence of the countermeasure. To control for this effect, control sites are also considered when this type of study is performed. The control site should be similar to the test site in as many ways as possible, but with no countermeasure applied. This was the method used for the current study. However, this method still does not totally account for regression to the mean.
An alternative approach has been advocated to deal with the problem of regression to the mean. This approach is called the Empirical Bayes approach (Hauer, 1997). The Empirical Bayes approach was not felt to be necessary for the current study, for the following reasons:
For these reasons, the traditional before-after case study with control was considered to be the appropriate method for analyzing the crash data for these exits. The next section presents the results of these analyses.
The first set of analyses compares the control sites to the test sites for a number of areas in order to evaluate whether the test sites were appropriate for comparison. In order to ensure that test sites experienced the same weather, were driven by the same drivers, and experienced similar traffic density over time, the closest adjacent exit was always used as the control exit. The control exits were always at least 3 miles but never more than 5 miles from the test exits. Control sites were compared to test sites on several dimensions, including weather (Figure 3), major factor (Figure 4), severity (Figure 5), driver age (Figure 6), driver gender (Figure 7), and driver action (Figure 8). As can be seen in these figures, the test sites and control sites were in remarkable agreement for these variables.
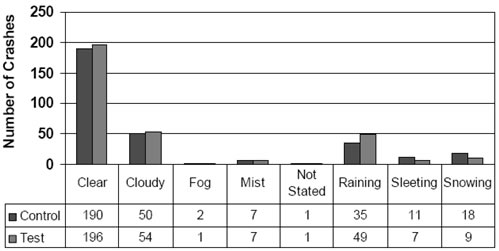
Figure3. Number of crashes under various weather conditions
for control and test sites.
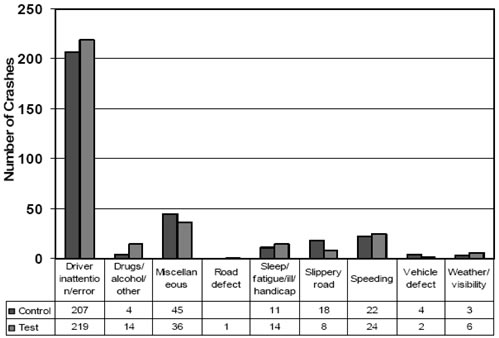
Figure 4. Number of crashes for major factor categories
for control and test sites.
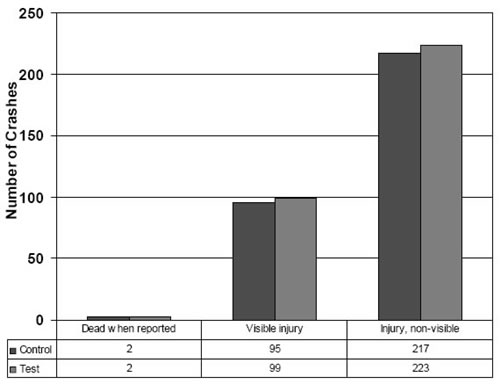
Figure 5. Number of crashes by severity category for
control and test sites.
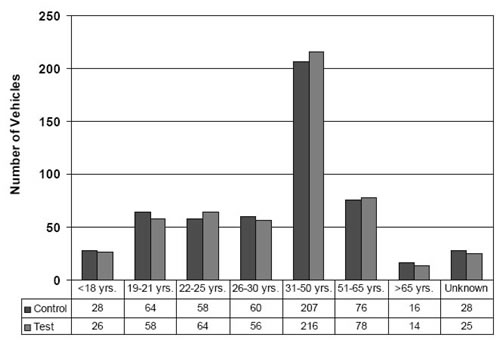
Figure 6. Number of vehicles involved in crashes by
driver age category for control and test sites.
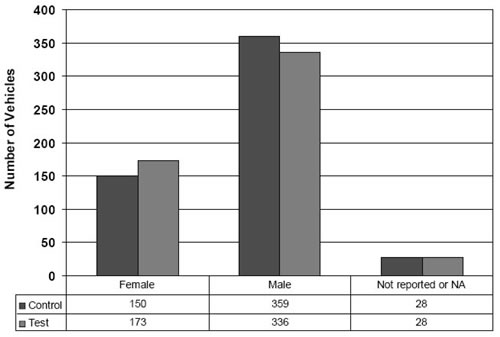
Figure 7. Number of vehicles involved in crashes by
driver gender for control and test sites.
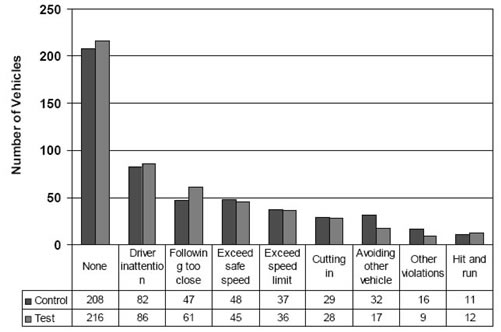
Figure 8. Number of vehicles involved in crashes by
driver action for control and test sites.
All sites combined. The next set of analyses considers crashes occurring at all sites combined. Figure 9 shows a map with all test and control sites marked in red. Figure 10 shows the raw number of crashes that occurred at these control and test sites. The number of crashes was not significantly different using a criterion of p< 0.05 (chi-square = 0.8084, p = 0.3686). The raw number of accidents was then weighted by the number of vehicle miles driven on those sections during the years of interest. The weighted number of accidents was then expressed in terms of crashes per million vehicle miles traveled (MVMT), which is a common measure of exposure in traffic safety. The weighted numbers are shown in Figure 11.
The final analysis examined the effects of both weather and inattention/error. Bad weather, when it occurs, can cause localized clusters of crashes. Therefore, the next analysis considered only crashes occurring in clear weather conditions. At the same time, only those crashes coded with inattention/error were included. This was done to examine the hypothesis that the additional logo signs would be found to be no more distracting and/or confusing to the motorist than a motherboard having combinations of logos such as Camping/Attractions. Figure 12 shows the results of this combined weather/distraction analysis. In this case, the results were significantly different (raw data chi-square = 4.5872, p = 0.0322). The significance was caused by the large before and after difference in the control site; the results were neutral with respect to the test site.
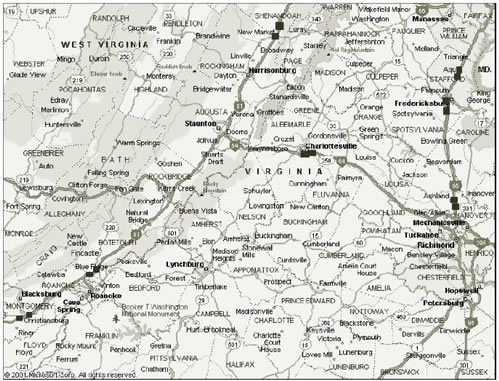
Figure 9. Map showing all of the test and control sites
(rectangles). Scale is ~1 inch = 40 miles.
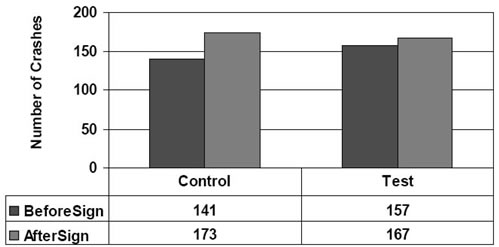
Figure 10. Raw number of crashes for all control and
test sites before and after the logo signs were installed.
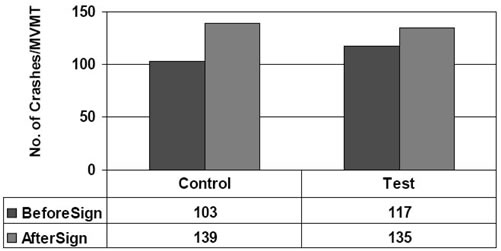
Figure 11. Crashes per MVMT for all control and test
sites before and after the logo signs were installed.
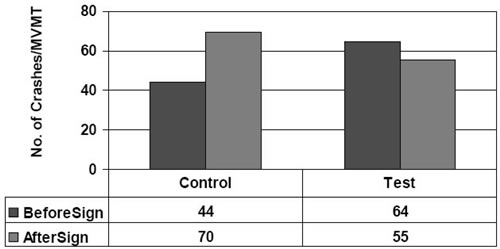
Figure 12. Crashes per MVMT occurring in clear weather
and coded due to inattention/error for all control and test sites before and
after the logo signs were installed.
I-64 at Exit 124. The map for this study area is shown in Figure 13. The following conditions and techniques were used in analyzing the crashes for this exit:
The total number of crashes per MVMT is shown in Figure 14. The differences were not significant (raw data chi-square = 0.0132, p = 0.9086). Those crashes in clear weather due to inattention/error are presented in Figure 15. In this case, there were not enough data points remaining to test statistically.
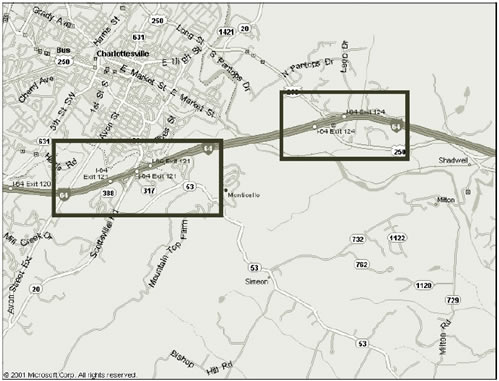
Figure 13. Map of I-64, exits 124 (test) and 121 (control).
Scale is ~1 inch = 1 mile.
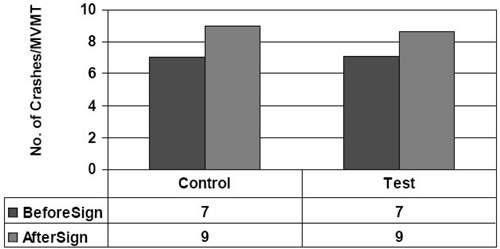
Figure 14. Crashes per MVMT for I-64, exits 124 (test)
and 121 (control) before and after the logo signs were installed.
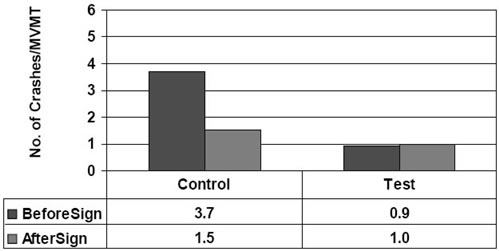
Figure 15. Crashes per MVMT occurring in clear weather
and coded as due to inattention/error for I-64 exits 124 (test) and 121 (control)
before and after the logo signs were installed.
I-81 at Exit 118. The map for this study area is shown in Figure 16. The following conditions and techniques were used in analyzing the crashes for this exit:
The total number of crashes per MVMT is shown in Figure 17 (raw data chi square = 0.0288, p = 0.8653), while those crashes in clear weather due to inattention/error are presented in Figure 18 (in this case, there were too few raw data points to analyze statistically).
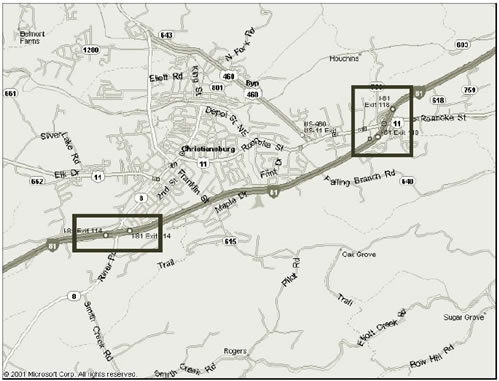
Figure 16. Map of I-81, exits 118 (test) and 114 (control.
Scale is ~1 inch = 1.5 mile.
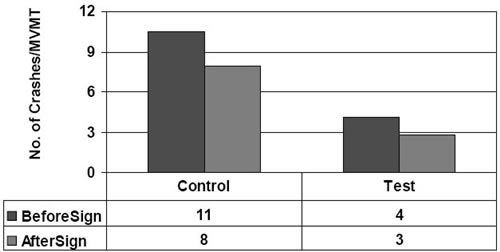
Figure 17. Crashes per MVMT for I-81, exits 118 (test)
and 114 (control) before and after the logo signs were installed.
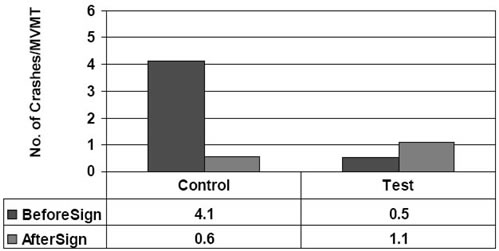
Figure 18. Crashes per MVMT occurring in clear weather
and coded as due to inattention/error for I-81, exits 118 (test) and 114 (control)
before and after the logo signs were installed.
I-81 at Exit 150. The map for this study area is shown in Figure 19. The following conditions and techniques were used in analyzing the crashes for this exit:
The total number of crashes per MVMT for these exits is shown in Figure 20 (not significant; raw data chi-square = 0.3948, p = 0.5298), while those crashes in clear weather due to inattention/error are presented in Figure 21 (not enough raw data points to analyze).
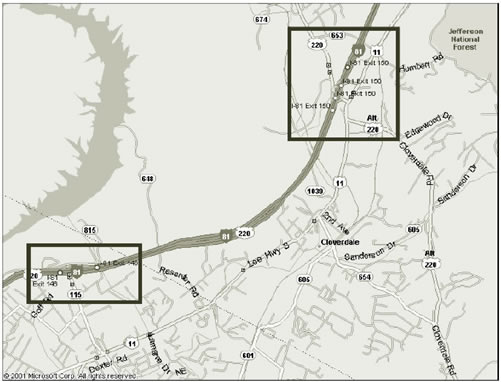
Figure 19. Map of I-81, exits 150 (test) and 146 (control).
Scale is ~ 1inch = 1.5 mile.
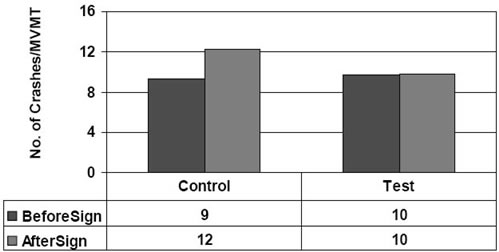
Figure 20. Crashes per MVMT for I-81, exits 150 (test)
and 146 (control) before and after the logo signs were installed.
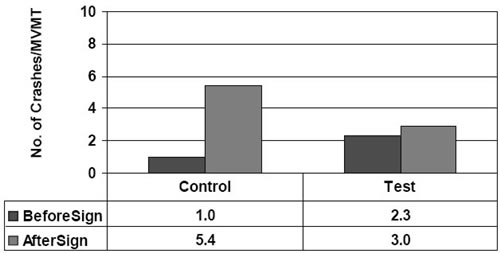
Figure 21. Crashes per MVMT occurring in clear weather
and coded as due to inattention/error for I-81, exits 150 (test) and 146 (control)
before and after the logo signs were installed.
I-81 at Exit 264. The map for this study area is shown in Figure 22. The following conditions and techniques were used in analyzing the crashes for this exit:
The total number of crashes per MVMT for this set of exits is shown in Figure 23 (not significant; raw data chi-square = 0.7066, p = 0.4006). Crashes in clear weather due to inattention/ distraction are presented in Figure 24 (not enough raw data points to analyze).
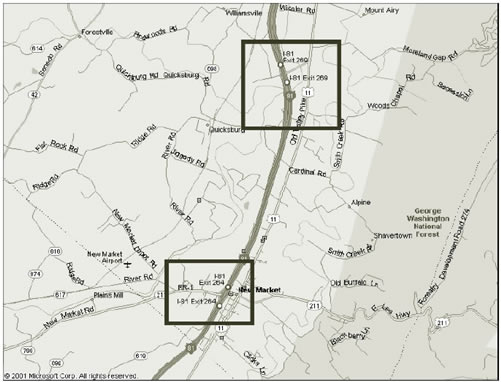
Figure 22. Map of I-81, exits 264 (test) and 269 (control).
Scale is ~ 1 inch = 2 mile.
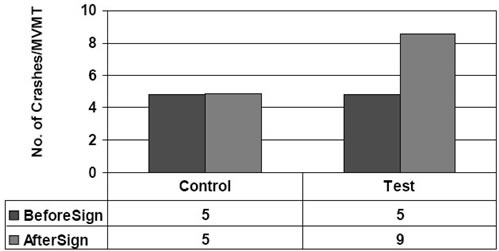
Figure 23. Crashes per MVMT for I-81, exits 264 (test)
and 269 (control) before and after the logo signs were installed.
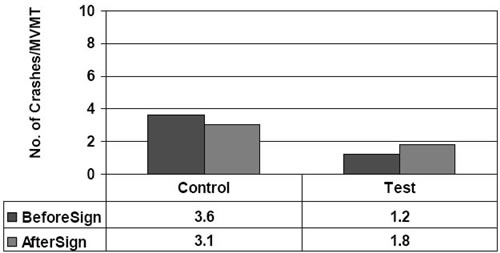
Figure 24. Crashes per MVMT occurring in clear weather
and coded as due to inattention/error for I-81, exits 164 (test) and 269 (control)
before and after the logo signs were installed.
I-95 at Exit 92. The map for this study area is shown in Figure 25. The following conditions and techniques were used in analyzing the crashes for this exit:
The total number of crashes per MVMT for these exits is shown in Figure 26 (not significant; raw data chi-square < 0.0000, p = 0.9975). Crashes in clear weather due to inattention/ distraction are presented in Figure 27 (also not significant; raw data chi-square = 0.5118, p = 0.4744).
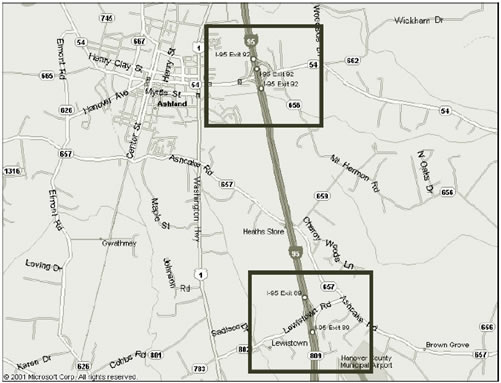
Figure 25. Map of I-95, exits 92 (test) and 89 (control).
Scale is ~ 1 inch = 1 mile.
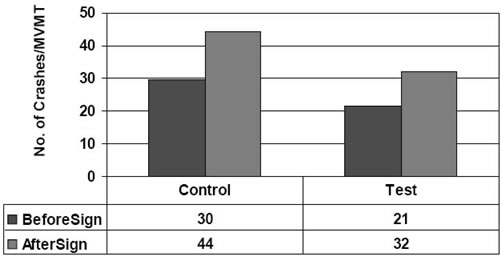
Figure 26. Crashes per MVMT for I-95, exits 92 (test)
and 89 (control) before and after the logo signs were installed.
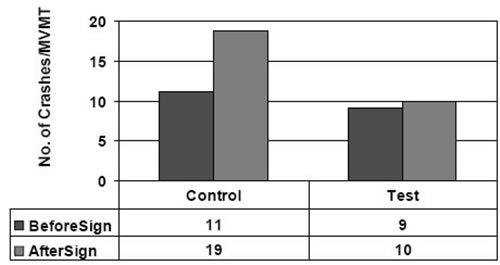
Figure 27. Crashes per MVMT occurring in clear weather
and coded as due to inattention/error for I-95, exits 92 (test) and 89 (control)
before and after the logo signs were installed.
I-95 at Exit 126. The map for this study area is shown in Figure 28. The following conditions and techniques were used in analyzing the crashes for this exit:
Since only southbound crashes were considered, the number of crashes for analysis was somewhat smaller than would otherwise be the case for this section of interstate. The total number of crashes per MVMT for these exits is shown in Figure 29 (significant; raw data chi-square = 5.1050, p = 0.0239). Once again, the significance was driven by a large before-after difference in the control site, while the test site had a neutral result. Crashes in clear weather due to inattention/ distraction are presented in Figure 30 (not enough raw data points to analyze).
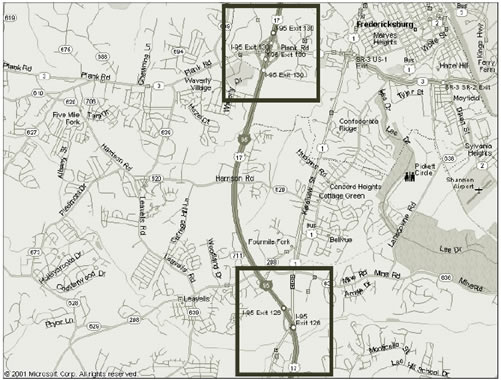
Figure 28. Map of I-95, exits 126 (test) and 130 (control).
Scale is ~ 1 inch = 1 mile. Only southbound crashes were considered.
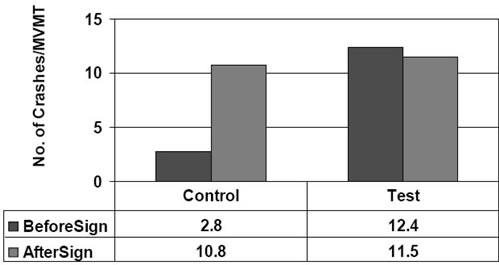
Figure 29. Crashes per MVMT for I-95, exits 126 (test)
and 130 (control) before and after the logo signs were installed. Only southbound
crashes were considered.
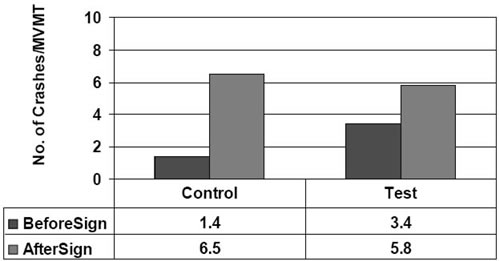
Figure 30. Crashes per MVMT occurring in clear weather
and coded as due to inattention/error for I-95, exits 126 (test) and 130 (control)
before and after the logo signs were installed. Only southbound crashes were
installed.
I-95 at Exit 143. The map for this study area is shown in Figure 31. The following conditions and techniques were used in analyzing the crashes for this exit:
The total number of crashes per MVMT for these exits is shown in Figure 32 (not significant; raw data chi-square = 0.3753, p = 0.5402). Crashes in clear weather due to inattention/distraction are presented in Figure 33. In this case, the differences were significant (raw data chi-square = 7.2738, p = 0.0070). However, the significance was driven by an increase in crashes at the control site with nearly the same magnitude decrease at the test site, so this finding is neutral with respect to the hypothesis.
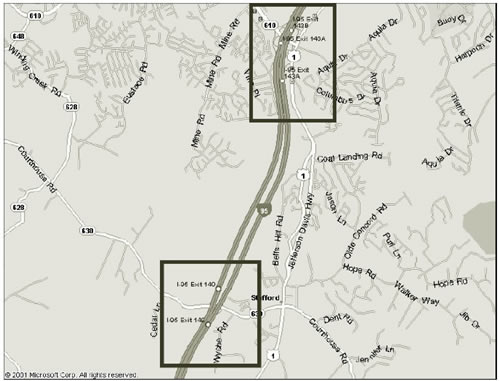
Figure 31. Map of I-95, exits 143 (test) and 140 (control).
Scale is ~ 1 inch = 1 mile.
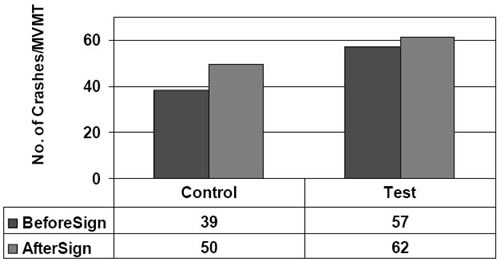
Figure 32. Crashes per MVMT for I-95, exits 143 (test)
and 140 (control) before and after the logo signs were installed.
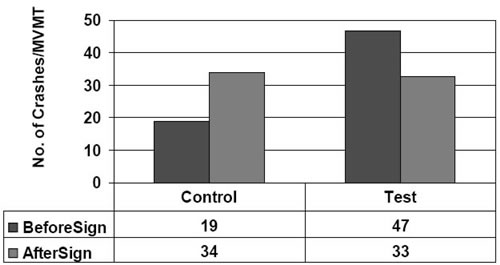
Figure 33. Crashes per MVMT occurring in clear weather
and coded as due to inattention/error for I-95, exits 143 (test) and 140 (control)
before and after sign installation.
At a preliminary presentation of these results, one audience member noted that this particular exit was in the vicinity of a great deal of maintenance work over the past few years, and that this could have contributed to the high numbers of crashes observed for this exit. It was noted that most or all of the maintenance work took place at night. An additional analysis was therefore conducted to examine the same data as shown in Figure 32, but now only including those crashes that occurred during daylight hours (to eliminate crashes that may have been caused by maintenance activities). As seen in Figure 34, the overall pattern remained the same, but the differences were no longer significant (raw data chi-square = 3.4667, p = 0.0626).
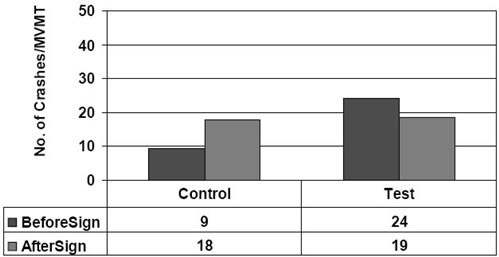
Figure 34. Crashes per MVMT occurring in daylight,
in clear weather, and coded as due to inattention/error for I-95, exits 143
(test) and 140 (control) before and after sign installation.
Results from the crash analysis showed that the data support Hypothesis 2, in that no additional safety risk was found to be caused by having more than six Food logos on two sign structures. The crash data generally showed no sign of an increased number of crashes at the test exits after the signs were installed. Where significant results were found, they were generally driven by changes in the control exits, and were neutral with respect to the test exit. There was nothing in the crash data results to suggest that the additional signs created an increase in crashes: 1) either during the year after they were installed as compared to the year before they were installed, or 2) as compared to an adjacent, test exit without the signs. The findings held true even when only crashes coded with inattention/error occurring in good weather were examined.
|
United States Department of Transportation - Federal Highway Administration |
||